
Since writing this, some statistics for 2013 were released and I have included the data from NASA at the bottom of this post. This data suggests that not only I, but you, too, would be wise to reduce our respective carbon footprints.
Story & Photos by Charmaine Coimbra

car·bon foot·print
noun: carbon footprint; plural noun: carbon footprints
1. The amount of carbon dioxide and other carbon compounds emitted due to the consumption of fossil fuels by a particular person, group, etc.
When a National Park Visitor Guide’s January lead story expresses, “…an uncertain future in the face of changing climate,” and then lists steps it is taking to reduce “…the Park’s carbon footprint,” my annual commitment seemed obvious: further reduce my carbon footprint.
We hear the phrase carbon footprint more frequently than when it arrived at our conversational doorstep in 1995. Some leaders and industrialists disdain the phrase. Others, like the Death Valley Visitor’s Center, centered in one of the world’s hottest regions, says carbon footprint reduction is the key to climate health—and cost reduction.
Space X and Tesla Motors CEO, Elton Musk, says, “We’re running the most dangerous experiment in history right now, which is to see how much carbon dioxide the atmosphere…can handle before there is an environmental catastrophe.”
Musk is not the end all expert, but his statement sums up the majority of opinions by viable scientists that, indeed, we’re messing with something we don’t fully understand.
Not everyone agrees that your or my collective carbon footprint amounts to a hill of beans. Others shiver at the thought of another law or more government. And those who profit greatly from fossil fuels are the first to challenge any notion of the need to reduce one’s carbon footprint.
So call me a tree hugger, earth mother, or some other name that suggests that I might live my life short of showers, begin my day with an herbal cleanse, and then ride my recycled Schwinn bicycle to resupply my vegan, gluten, sugar, salt-free pantry. The truth is far from this misplaced identification.
From my respectable home in a desirable neighborhood with two cars in the driveway, it’s easier to identify me as classic mid-America.
As a mid-American, I prefer balance, equity, and savings. This is why I’m working to further reduce my carbon footprint. It won’t be perfect. I’ll commit grave acts against the planet. I’ll fall off the wagon like a dieter craving a plate of cake and ice cream. But because I understand that the universe does not revolve around me, and that our planet is an interconnected entity that links me to God, the universe, the great power, or whatever one wishes to define this source, I sense duty to planetary mindfulness.
My annual carbon footprint average as of Jan. 1, 2014 reads as follows:
- Your footprint is 11.65 metric tons per year
- The average footprint for people in United States is 20.40 metric tons
- The average for the industrial nations is about 11 metric tons
- The average worldwide carbon footprint is about 4 metric tons
- The worldwide target to combat climate change is 2 metric ton

So what will I change?
- If engineering allows, expect to see solar panels on my roof by year’s end.
- Self-improvement is a natural reduction. This may be my biggest challenge, but I can surely (and much to my benefit) find more reasons to walk to the bank, consume less sugar and empty calories, read more books, and watch less television.
- Plant four fruit trees where useless shrubs consume water.
- Garden more.
- Continue discovering ways to not consume any more plastic than necessary.
- Eat less meat. Meat production is one of our planet’s biggest environmental offenders.
“Livestock production accounts for 18 percent of global greenhouse gas emissions, including 9 percent of carbon dioxide and 37 percent of methane gas emissions worldwide, according to the Livestock, Environment and Development (LEAD) Initiative, an international consortium of government and private agencies based at FAO headquarters in Rome,” writes Cassandra Brooks for the Stanford Woods Institute for the Environment.
- Shop as local as I can.
- Buy American made products.
Presently, California, where I live, is experiencing a serious drought. At this point in the year, my neighborhood should drip and feed mold with about 18-24 inches of rain for the season. Thus far, the rain gauge measures about ¼ of an inch of rain for the entire season. We can water our yards once a week. We’re expected to reduce household water usage by at least 20%. I fully expect draconian water reduction rules if significant amounts of rain don’t green up our lovely hillsides soon.
So add water use reduction to my list.
Will I save the planet? Well, to quote the Roman poet Ovid, “Dripping water hollows out stone, not through force but through persistence.” I have one of those rocks in my garden. It’s an excellent example, that, yes, one drop of water can pierce stone and create change.
I’ll share my 2014 carbon footprint report card next year.
——–
From: http://earthobservatory.nasa.gov/IOTD/view.php?id=82918&eocn=home&eoci=iotd_previous

An analysis of global temperatures by NASA scientists shows that 2013 was the seventh warmest year since 1880 (tied with 2006 and 2009). Nine of the 10 warmest years on record all have occurred since 2000, with 2010 and 2005 ranking as the warmest. Scientists at NASA’s Goddard Institute for Space Studies (GISS) reported that 2013 continued the long-term trend of rising air temperatures over the land and sea surface.
The top map above depicts global temperature anomalies in 2013. It does not show absolute temperatures, but instead shows how much warmer or cooler the Earth was compared to an averaged base period from 1951 to 1980. The GISS team assembles its analysis with publicly available data from roughly 6,300 meteorological stations around the world; ship-based and satellite observations of sea surface temperature; and Antarctic research station measurements. For more explanation of how the analysis works, read World of Change: Global Temperatures.
The global average temperature for 2013 was 14.6° Celsius (58.3° Fahrenheit), which is 0.6°C (1.1°F) warmer than the mid-20th century baseline. The average global temperature has risen about 0.8°C (1.4°F) since 1880. Exact rankings for individual years are sensitive to data inputs and analysis methods.
“Long-term trends in surface temperatures are unusual, and 2013 adds to the evidence for ongoing climate change,” said GISS climatologist Gavin Schmidt. “While one year or one season can be affected by random weather events, this analysis shows the necessity for continued, long-term monitoring.”
Weather patterns and other natural cycles cause fluctuations in average temperatures from year to year. This is especially the case on regional and local levels. For instance, while the globe experienced notably warm temperatures in 2013, the continental United States had its 42nd warmest year, according to GISS analysis. On the other hand, 2013 was the hottest year in Australia’s recorded history.
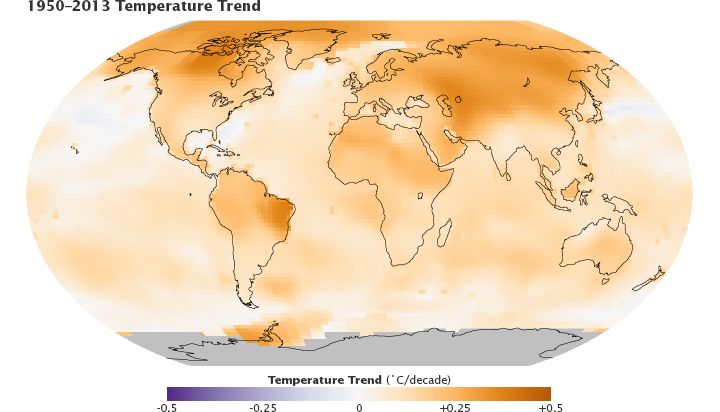
Regardless of the regional differences in any year, continued increases in greenhouse gas levels in Earth’s atmosphere are driving a long-term rise in global temperatures. Each calendar year will not necessarily be warmer than the year before. But with the current level of greenhouse gas emissions, scientists expect each decade to be warmer than the previous one. The decade-by-decade temperature trend is depicted in the second map above and in the downloadable animations.
It has been 38 years since the recording of a year with cooler than average temperatures. The graph below shows how the long-term temperature trend has continued to rise even when El Niño and La Niña events skew temperatures warmer or colder in any one year. Orange bars represent global temperature anomalies in El Niño years, with the red line showing the longer trend. (The classification of years comes from the NOAA Oceanic Niño Index.) Blue bars depict La Niña years, with a blue line showing the trend. El Niño/La Niña neutral years are shown in gray, and the black line shows the overall temperature trend since 1950. Note that even the La Niña years are warmer than they used to be.

Scientific evidence says the level of carbon dioxide in Earth’s atmosphere presently is higher than at any time in the past 800,000 years. In 1880, the first year included in the GISS analysis, the global carbon dioxide level was about 285 parts per million; by 2013, it peaked at more than 400 parts per million. Carbon dioxide is a greenhouse gas that traps heat and plays a major role in controlling changes to Earth’s climate. It occurs naturally and also is emitted by the burning of fossil fuels.
-
Related Reading
- NASA Earth Observatory (2012) World of Change: Global Temperatures.
- NASA Goddard Institute for Space Studies GISS Surface Temperature Analysis (GISTEMP).
- NASA Earth Observatory (2011, January 14) Different Records, Same Warming Trend.
- NASA Earth Observatory (2007, November 5) Earth’s Temperature Tracker.
- NASA Earth Observatory (2010, June 3) Global Warming.
- NASA Earth Observatory (2013, March 26) Arctic Amplification.
- NASA Earth Observatory (2013, September 27) Global Patterns of Carbon Dioxide.
- NASA Earth Observatory (2011, June 16) The Carbon Cycle.
NASA images by Gavin Schmidt and Robert Simmon, based on data from the NASA Goddard Institute for Space Studies. Caption by Mike Carlowicz and Michael Cabbage.

2 thoughts on “I Can’t Save the World—But I Can Reduce My Carbon Footprint”